PetroAlchemy Alpha Tutorial
Contents

What is PetroAlchemy?
PetroAlchemy is a desktop application written using python and tkinter. Python is a very popular general purpose coding language. It is used to create websites, machine learning models, and data science tools. If you would like to learn more I would encourage you to go to python.org and read the documentation. Tkinter is a standard library included with python used to create desktop applications, which means it is supported and packaged with python instead of a 3rd party. I used tkinter to simplify my code and reduce time to launch. Tkinter may not remain as the gui interface permanently. There are more advanced gui tools such as Qt, but at the moment I am not comfortable enough with the Qt API.
With the basic coding technical introduction aside, PetroAlchemy is essentially a tool to import a production file for an oil or gas well and estimate the cashflow. For reserves most people either want a type curve or forecast for a current producing well. PetroAlchemy has the capability to estimate economics (financials) for a type well profile based on a current producer(s), commonly referred to as a Type Curve, or it can be used to forecast production and revenue for a producing well.
Use Case for PetroAlchemy
Reservoir engineers and petroleum evaluators typically use commercial software to forecast and model well production. There are standard software packages used to model reserves that is required for auditing, and bank purposes. PetroAlchemy is in no way a replacement for these commercial packages. Rather, PetroAlchemy is a tool for an evaluator to quickly estimate or understand the order of magnitude a forecast or type well profile might look like. For instance, an evaluator might need to pull public production and analyze the profitability of a well, but unless a “dummy” database is set up for this purpose it can be tedious to perform this action.
PetroAlchemy can provide an easy way to quickly import raw data and get an estimate in a few minutes. As with any forecast, the assumptions and limitations must be acknowledged in the forecast output. But just because an estimate is quick to reach does not lessen how useful the answer might be. Knowing whether a well’s EUR (Estimated Ultimate Recovery) is 100 MBO (Thousand Barrels of Oil) or 1,000 MBO is significant, but not always easy to infer visually from historical production.
How to get PetroAlchemy
The first release of the package is available in Alpha phase. The easiest way to get the software if you are using a Windows 64-bit machine is to download the Windows installer from the README installation section. If you do not know if you are running 32-bit or 64-bit then type about your pc in the Windows search bar and it should list it under System type.
The Windows installer will ask you where to store the application and the associated files. Once the installer is finished there will be a PetroAlchemy shortcut on your desktop. You should also be able to search for PetroAlchemy or find the PetroAlchemy.exe file wherever you saved it and run the application.
If you are using a Linux machine I am working on packaging for 64-bit Linux as well. Currently I do not have an easy way to package for mac using VirtualBox or other means. If you are interested in helping me with that I would appreciate the input.
The alternative from using a Windows or Linux installer would be to clone the github repository and run the python code yourself if you already are comfortable with doing that.
How to import data
PetroAlchemy supports Excel workbooks (.xlsx) and CSV (.csv) production files. Refer to the data_example folder either on github or in your installation folder.
Currently the production file must use the below column format:
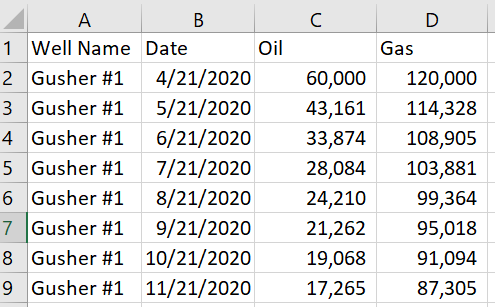
The column names must be Well Name, Date, Oil, and Gas. If your data is not set up this way you will have an import error in the application. You can import multiple wells at once if your file has more than one well in the Well Name column of your import file.
Once the application is running you can import your data by clicking the Import Well Data button on the home page, or by clicking File > Import Production. After a successful import the data is available to be selected as the well for analysis by selecting it using the dropdown box on the home page.
How to fit decline curves
You can select which well to analyze by using the dropdown box on the home page. The current well selected will appear in the status bar in blue at the bottom of the screen. You can also go to the next well by pressing ctrl+j, and go to the previous well by pressing ctrl+f.
The selected well’s production will be shown on the Production Plot tab. Click the tab to view the data you just imported. On the left side of the screen you will see all of the decline curve parameters for Arps Decline. PetroAlchemy will use either an exponential, hyperbolic, or harmonic decline depending on what B Factor is selected. PetroAlchemy will automatically switch to exponential terminal decline based on the minimim decline selected. This tool is only useful if you have a reasonable understanding of how decline curves are constructed. For a refresher on decline curves and the equations used in PetroAlchemy refer to the References.
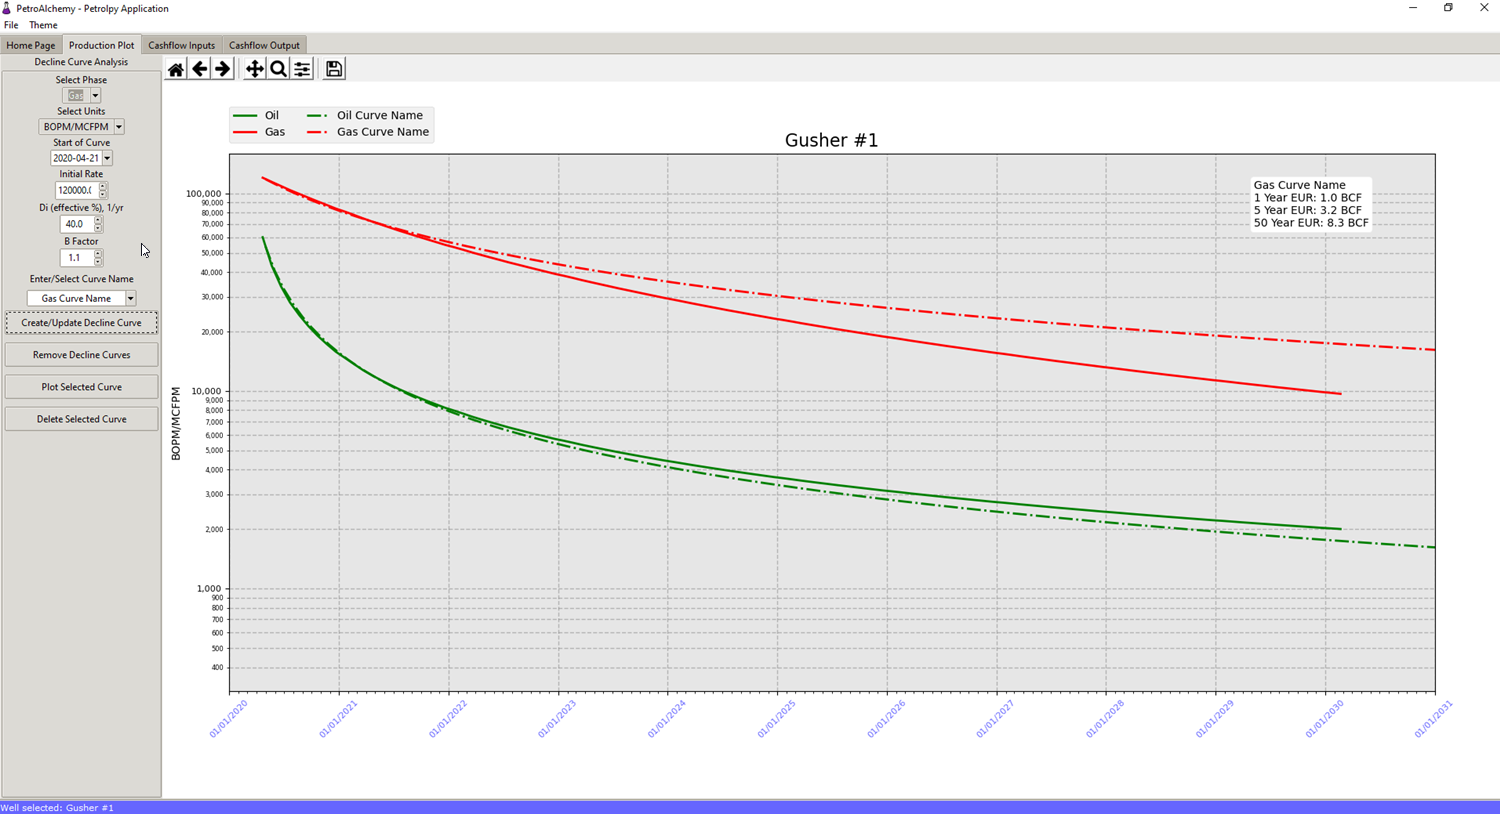
PetroAlchemy models one decline curve or forecast at a time. First select the phase to model (Oil or Gas), the Date you want the forecast to start from, and then the usual Arps parameters. Note that PetroAlchemy has filled in an estimate for the rate and Di based on the first year of production imported.
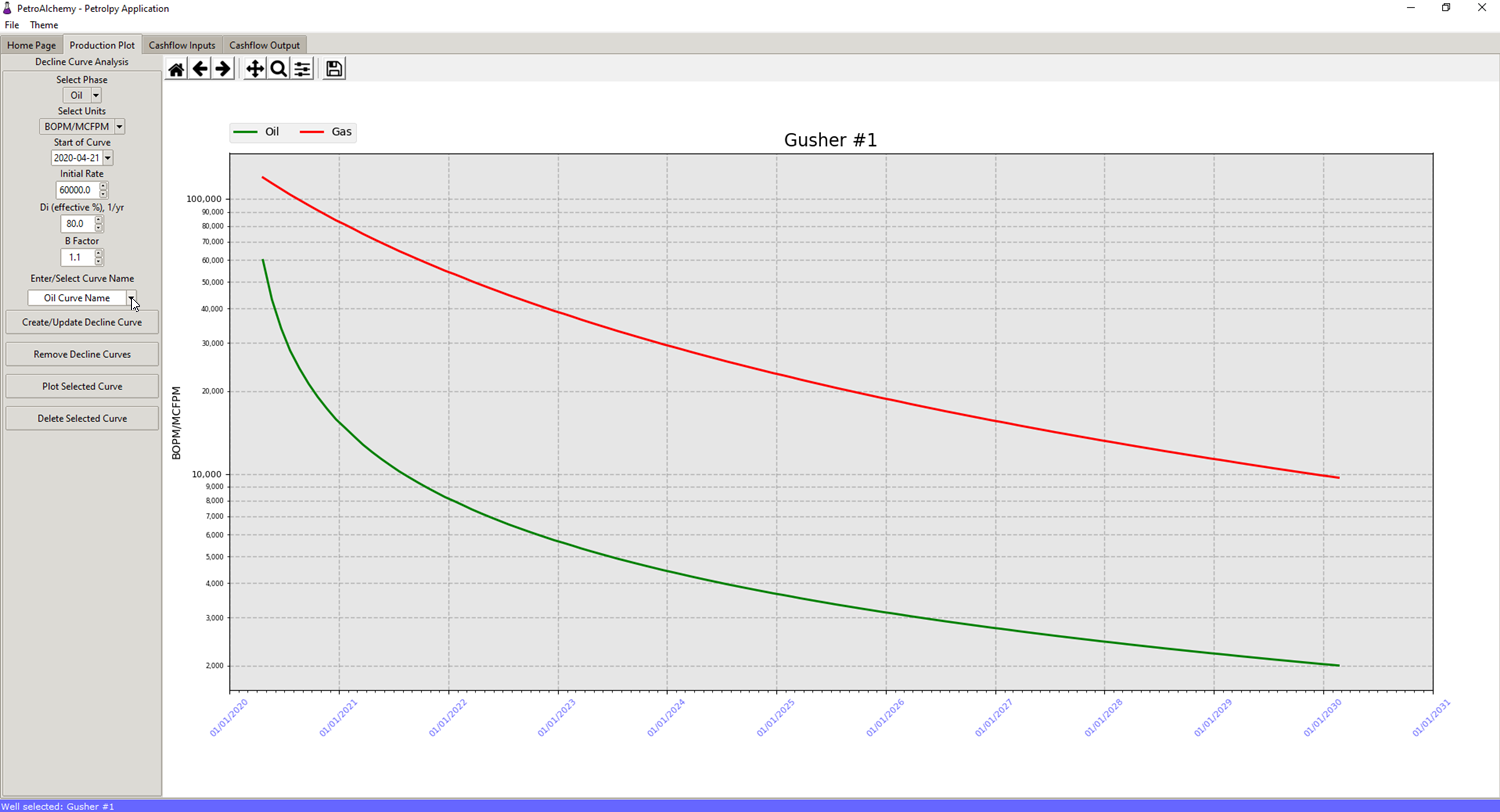
Once your parameters have been filled in for a first look type in a special name for the curve linked to the phase you have selected. It will save the curve with the default name if you do not provide one. Select Create/Update Decline Curve to save the curve model based on the parameters and show it on the plot. Once a curve exists you have four options represented as buttons:
- Create/Update Decline Curve: if a curve already exists and is selected in the Enter/Select Curve Name box, this button will update the curve parameters and plot it to the graph
- Remove Decline Curves: removes the decline curves from the plot, but does not delete them. This button is to clear the plot if too many curves are plotted.
- Plot Selected Curve: this will add the selected curve in the Enter/Select Curve Name box to the plot.
- Delete Selected Curve: this will delete the selected curve in the Enter/Select Curve Name box from the application.
If you want to modify a curve you have already made instead of making a new curve every time you change the parameters, then select the curve name from the dropdown box, modify any parameters, and select Create/Update Decline Curve again to update the named curve.
How to run financials for a well using decline curves
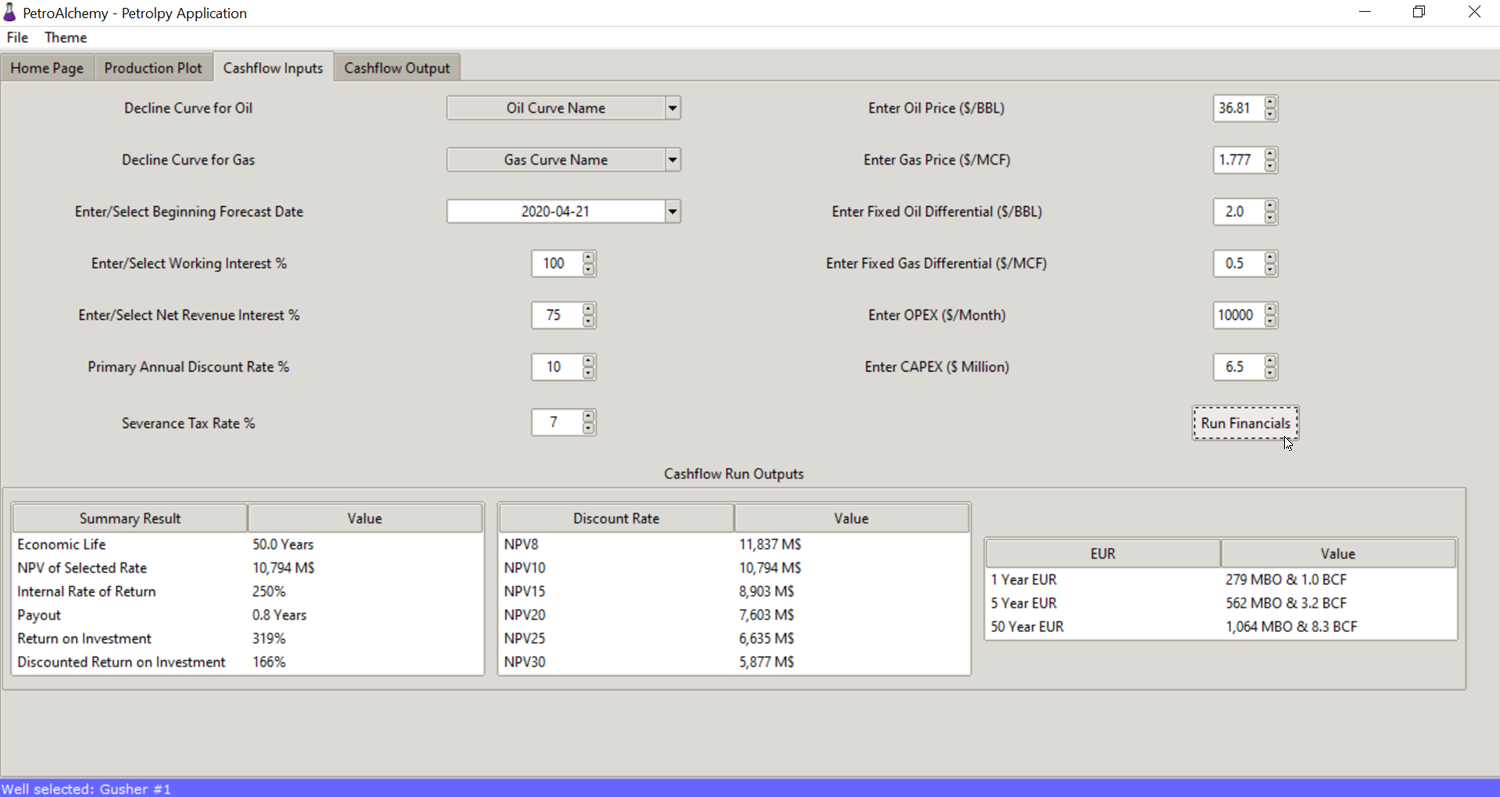
Once a curve has been saved for an oil and gas phase, a cashflow using the forecasts can be created. Select the Cashflow Inputs tab to see the economic input options. Any curve saved can be selected to be used for the cashflow using the dropdowns. The key inputs for any petroleum evaluation cash flow can be entered. If any of the terms are unfamiliar look back to the references previously provided.
In this Alpha release the prices, operating expense (OPEX), and capital expense (CAPEX) are static and can not change by month. The prices and OPEX will be used for every month’s calculation of income. The CAPEX is applied in the first month as one lump sum.
Once you have changed the Cashflow Input parameters however you like, select the Run Financials button on the bottom right. The Cashflow Run Outputs will be filled in with the summary results for a high level review of the forecast that was just ran. The current outputs are not any standard, but outputs I would like to see when running a cash flow.
You can also view the simple text output of the cashflow by month by selecting the Cashflow Output tab. Currently you cannot group the output in the application in any way, by year for example, but that could be added if requested.
How to save financial cash flow output
You can save the entire cashflow output run to excel by selecting File > Save Cashflow. Once exported to excel it is easy to use a pivot table to change or alter the data in how you would like to see it.
How to get EIA front month futures prices
If you want PetroAlchemy to automatically use the WTI and Natural Gas futures front month contract prices, then you need to get a free API key from eia.gov here. Once you register and receive an API key from eia.gov, find your app_settings.json file which should be in your PetroAlchemy folder you installed the program in. Open the json file and replace EIA_API_KEY with your API key eia.gov emailed you. Make sure your api key is surrounded by quotes in the json file. Now PetroAlchemy will pull the front month prices and place them as the oil and gas prices on the Cashflow Input tab.
Looking forward
This project is something I have wanted to launch for a while. Petroleum engineers need more open source options to help learn different aspects of the industry. Engineers also might not have access to commercial licenses for software used in decline curve analysis. My goal is to provide tools through open source that will improve with community contributions and feedback.
Before sharing this project I do not know how many people will find this useful, but I want to help foster collaboration for open source petroleum engineering tools and projects. In my view PetroAlchemy is one of many tools that will be created by the petroleum open source community. If you have ideas for PetroAlchemy please create a new issue with a feature request on the project’s github.